
Goldman Copper Charts
A selection of charts from Goldman's recent copper report supporting higher prices

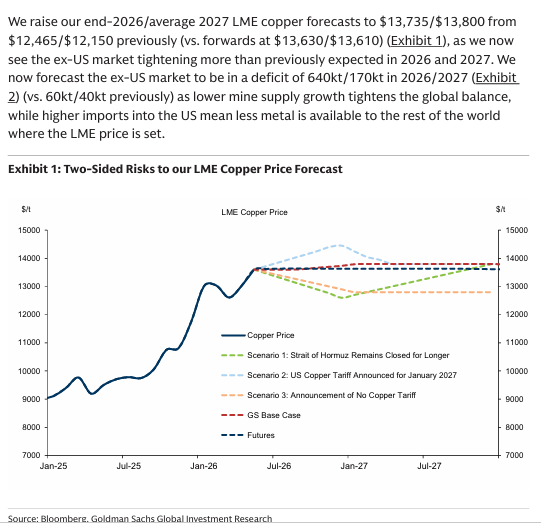
In its report dated June 1, 2026 Goldman Sachs raised its end-2026/average 2027 LME copper forecasts to $13,735/$13,800 from $12,465/$12,150 previously:
Mine supply disruptions are tightening the global copper balance, with GS reducing its 2026/2027 supply by 350,000 ounces due to slower operational recoveries at Grasberg and Kamoa-Kakula.
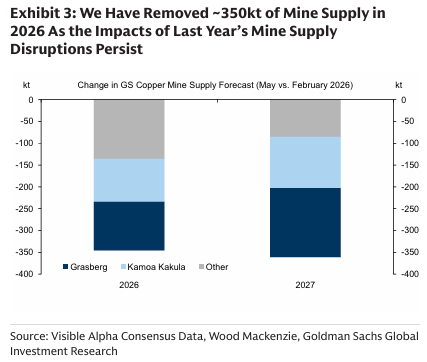
Grasberg and Kamoa-Kakula are two super mines responsible for a significant amount of global copper production, and neither mine is expected to return to full production capacity until 2028.
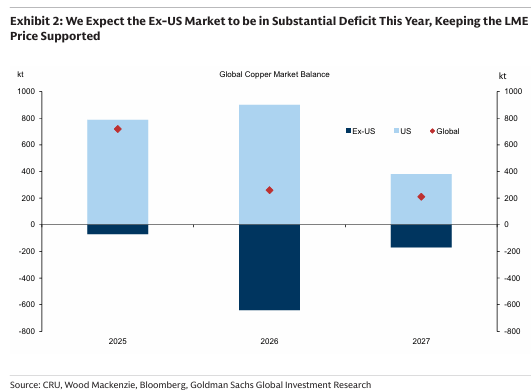
Meanwhile, the U.S. has been vacuuming up copper with record levels of imports:
There is potential for US copper tariff to be announced this month, but it wouldn’t start until January 2027—if this happens it would likely trigger an acceleration of US copper imports in H2 2026. Of course, this would be pulling forward of demand, potentially causing a hangover for copper demand/prices in 2027.
Finally, I really like this graphic illustrating LME copper price sensitivity relative to visible LME inventory builds/draws:
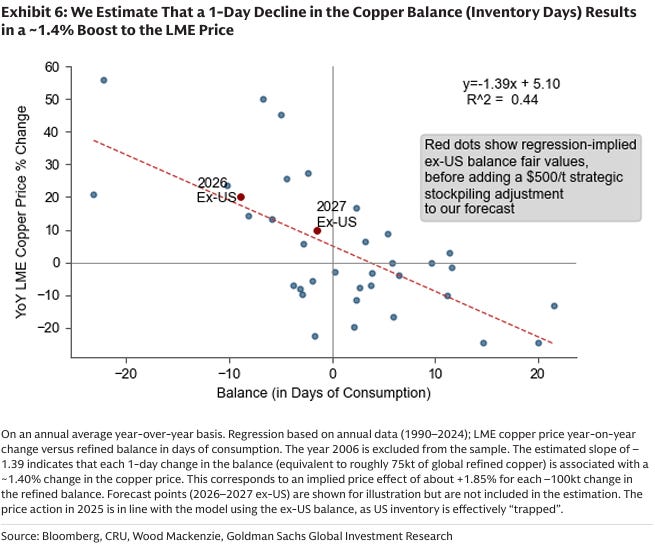
Goldman sees copper trading above its 2026 fair value estimate at $13,600/tonne, but this is not a market begging for an immediate reversal.
Speculative capital has clearly found its way into copper, helped by the broader rotation into hard assets. Copper sits at the center of several strategic demand pillars—energy security, AI/data centers, grid buildout, defense, and reshoring—while new supply remains constrained, slow-moving, and increasingly expensive.
In other words, even if copper is no longer “cheap”, the market has good reasons to stay tight and well-bid.
GS also struggles to see a near-term catalyst for meaningful speculative outflows. Outside the U.S., the market is already looking ahead to a potential tightening dynamic as American copper imports are likely pulled forward over the coming months. That could keep physical availability tight, reinforce the bullish narrative, and make it difficult for funds to step away from the trade.
DISCLAIMER: The work included in this article is based on current events, technical charts, company news releases, corporate presentations and the author’s opinions. It may contain errors, and you shouldn’t make any investment decision based solely on what you read here. This publication contains forward-looking statements, including but not limited to comments regarding predictions and projections. Forward-looking statements address future events and conditions and therefore involve inherent risks and uncertainties. Actual results may differ materially from those currently anticipated in such statements. This article is provided for informational and entertainment purposes only and is not a recommendation to buy or sell any security. Always thoroughly do your own due diligence and talk to a licensed investment adviser prior to making any investment decisions. Junior resource companies can easily lose 100% of their value so read company profiles on www.SedarPlus.ca for important risk disclosures. It’s your money and your responsibility.