
JP Morgan Makes A Compelling Case For $6,000 Gold But Trump's Tariff Turnaround Jolts The Yellow Metal
Last week, a JP Morgan research report made a compelling case for gold to reach $6,000/oz within the next four years.

Last week, JP Morgan published a report that contained a thesis that redirecting just 0.5% of foreign US asset holdings to gold could drive the gold price to $6,000. For gold investors this is one of those pinch me moments; one of the largest US banks is spilling pages of ink to promote the idea that a small shift away from US asset holdings into gold could propel gold to nearly double in price.
Of course, the market Gods had the good humor of sending gold $150/oz lower since the JPM report was published last week. Let’s dig into the report and then we will conclude this post by analyzing the technical situation in gold.
The crux of the JPM report is that global investors are rethinking the “exorbitant privilege” and safe haven status of the US dollar. As a result, gold stands to be a primary beneficiary of flows away from US assets.
Key takeaways from the report:
Foreign investors hold ~$57 trillion in U.S. financial assets (200% of U.S. GDP).
Composition includes equities ($16.9–$19T), Treasuries ($8.8T), corporate bonds (
$5T), FDI ($16T).Recent geopolitical tensions, U.S. fiscal instability, and trust erosion in U.S. institutions are prompting global reassessment.
Gold represents just ~4% of total global financial assets.
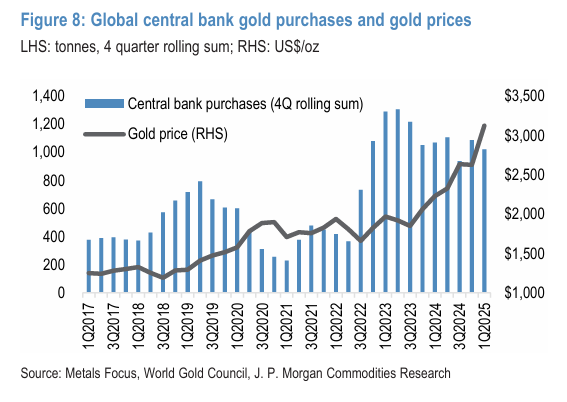
Central bank buying (more than 1,000 tonnes annually) has already driven a 90% rally in gold since 2022.
Gold demand remains strong amid stagflation fears, currency debasement, and geopolitical risks.

In a hypothetical reallocation scenario:
If 0.5% (~$273B) of foreign U.S. asset holdings shift to gold over 4 years:
This equals ~2,500 tonnes (17B/quarter = ~157 tonnes/quarter).
Historical demand-price regression suggests ~3.4–5.0% QoQ gold price gains.
Gold could reach $6,000/oz by early 2029 (~18% annualized return).
A small structural reallocation to a relatively small market like gold with limited supply growth can have a very large impact on prices. Unlike oil or a base metal like nickel, higher gold prices only result in a marginal increase in supply.
Even with gold in the midst of a bull market, gold mine supply is only growing at ~1% annually. Inelastic gold mine supply is a product of many factors including declining grade of ore deposits, long permitting timelines, and high cost of capital for many gold mining companies.
Simply put, if foreign investors conclude that the US is now a less reliable trading partner, a riskier investment market, and the US dollar begins to lose its luster as the global reserve currency, then gold stands to benefit in a big way.
The JPM report helps to put into perspective today’s ~$100/oz drubbing in gold. By drastically de-escalating the tariff situation with today’s announcements the Trump administration has provided some trade relief to what was becoming a very dire situation between the US and China. A heated trade war between the US and its largest trading partners (EU and China) would be extremely negative for the global economy and likely result in capital flight from US assets. By signaling that the US is open to compromise, the worst case scenarios have been taken off the table. In addition, the Fed is now less likely to cut interest rates at its next couple meetings, a positive for the US dollar.
While one could make a cogent case that nothing was truly settled between the U.S. and China, market prices are determined at the margin, and after today’s developments, the macro backdrop is less favorable for gold than it was a week ago.
Let’s take a look at the gold daily chart:
Gold (Daily)

Today’s sell-off found support at almost exactly the same level that gold found support on May 1st. The ~$3,200 level now represents the first line of defense and a critical support level; a strong breakdown below $3,200 would tip the scales in favor of a top being put in place in April. Additionally, a breakdown below $3,200 would project further downside to a support zone that was successfully tested during the Tariff Turmoil of early April ($2,950 to $3,000).
At this point, it seems exceedingly likely that the $3,200 level will be breached within the next week or so. However, during its 2025 ascent, gold has demonstrated an uncanny ability to hold key support levels and quickly rebound. Therefore, while the odds now appear to be stacked against the yellow metal in the near term, we should remain mindful of the potential for bear traps to be sprung at the most opportune moments.
DISCLAIMER: The work included in this article is based on current events, technical charts, company news releases, corporate presentations and the author’s opinions. It may contain errors, and you shouldn’t make any investment decision based solely on what you read here. This publication contains forward-looking statements, including but not limited to comments regarding predictions and projections. Forward-looking statements address future events and conditions and therefore involve inherent risks and uncertainties. Actual results may differ materially from those currently anticipated in such statements. This article is provided for informational and entertainment purposes only and is not a recommendation to buy or sell any security. Always thoroughly do your own due diligence and talk to a licensed investment adviser prior to making any investment decisions. Junior resource companies can easily lose 100% of their value so read company profiles on www.SedarPlus.ca for important risk disclosures. It’s your money and your responsibility.