
Technical Analysis: The Beauty Is In The Simplicity
The Strait of Hormuz saga that we've witnessed over the last few months is highly instructive in terms of technical analysis and market psychology.

I can’t recall a noisier period in market history than what we just lived through since the beginning of March. The noise has been steady, loud, and full of contradictions.
Headline after headline about the Strait of Hormuz, war reports, negotiation updates, and of course the daily ‘truths’ from the President himself. At some point towards the end of March, I tuned it all out and stopped believing there was any signal in any of these updates regarding the US/Iran/Israel situation in the Middle East.
Meanwhile, other market participants and commentators appeared to get buried in the noise. By mid-March, a cadre of Hormuz pontificators formed across social media and the financial blogosphere. Their main goal was to forecast a $200+ oil price, a stock market crash, and other assorted catastrophic outcomes that included a variety of doomsday scenarios.
The popular “doomsday” scenarios clustered around Strait of Hormuz closure → energy shock → fertilizer shock → food shock → political instability. Some of the more dramatic commentary went as far as famine or mass starvation in the developing world, but the more sober version was: higher fuel, higher fertilizer, higher food prices, and acute stress in import-dependent poor countries.
Meanwhile, those of us who believe in the wisdom of markets and the power of charts were able to quickly deduce the improbability of many of these dramatic bear porn scenarios.
Despite a Strait of Hormuz ‘closure’ that dragged on into April, May, and finally June the price of oil was making lower highs and stocks were making higher highs.
WTI Crude Oil (Daily)
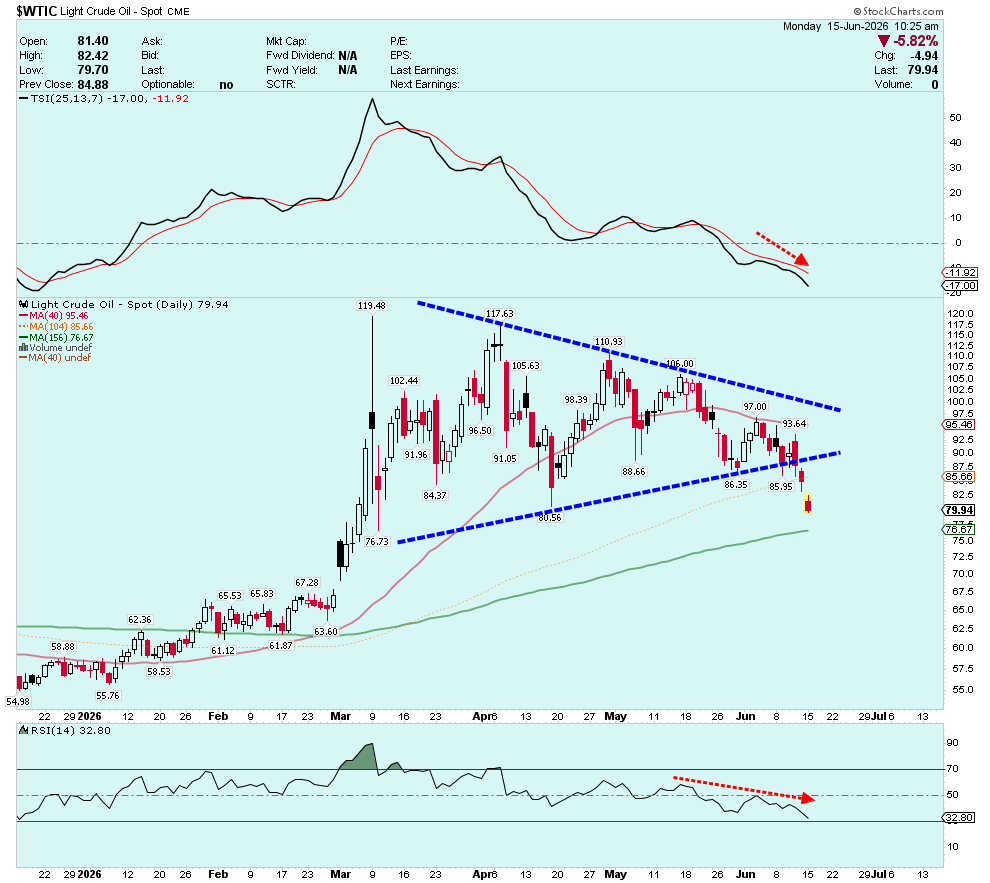
As WTI crude began pressing against the bottom rail of its symmetrical triangle, the volume of dire prognostications only seemed to grow louder. Over the last several weeks, the usual merchants of bear porn were out in force — warning of oil shocks, fuel shortages, and cascading doomsday scenarios.
Then, by the end of last week, the multi-month chart pattern resolved lower in decisive fashion.
For technicians, this outcome should not have come as a surprise. Since April, fading momentum and steadily weakening price action had been flashing warning signs beneath the surface. But for those who became mesmerized by the apocalyptic narratives — instead of listening to price — the breakdown likely arrived as both a shock and an expensive lesson.
To be clear, the crude oil chart didn’t predict a decline in oil, but throughout May and early June it warned that a large breakdown was becoming an increasingly likely outcome.
Technical Analysis 1
Permabear Pundits 0
The beauty of charts is often in the power of their simplicity. Price is the #1 fundamental and Mr. Market is smarter than you think.
DISCLAIMER: The work included in this article is based on current events, technical charts, company news releases, corporate presentations and the author’s opinions. It may contain errors, and you shouldn’t make any investment decision based solely on what you read here. This publication contains forward-looking statements, including but not limited to comments regarding predictions and projections. Forward-looking statements address future events and conditions and therefore involve inherent risks and uncertainties. Actual results may differ materially from those currently anticipated in such statements. This article is provided for informational and entertainment purposes only and is not a recommendation to buy or sell any security. Always thoroughly do your own due diligence and talk to a licensed investment adviser prior to making any investment decisions. Junior resource companies can easily lose 100% of their value so read company profiles on www.SedarPlus.ca for important risk disclosures. It’s your money and your responsibility.