

One of the most common exchanges I read on investment chat forums goes something like this:
Person A: “This chart looks great, it’s a breakout! This could be the next great billion dollar discovery!! I’m going all-in!!”
Person B: “But there’s a gap in the chart at $1.20. The gap needs to fill first.”
Person C: “There’s another gap at $.77…this stock isn’t going anywhere.”
Person A: “Charts are for weirdos….. this is going to be the next billion dollar buyout by a major…. I heard a rumor that the drillers are buying….”
Anyway, just kidding. But the above conversation isn’t too far from reality at times. In fact, perhaps I didn’t embellish enough.
The point is that there is a widespread misconception that all gaps in stock charts need to fill. While it is true that most gaps do get filled in, simply as a result of market volatility. The fact is that some gaps never get filled.
Great Bear? Pretty sure there were some gaps in that chart down around $.58…. GBR was acquired by Kinross for $29/share.
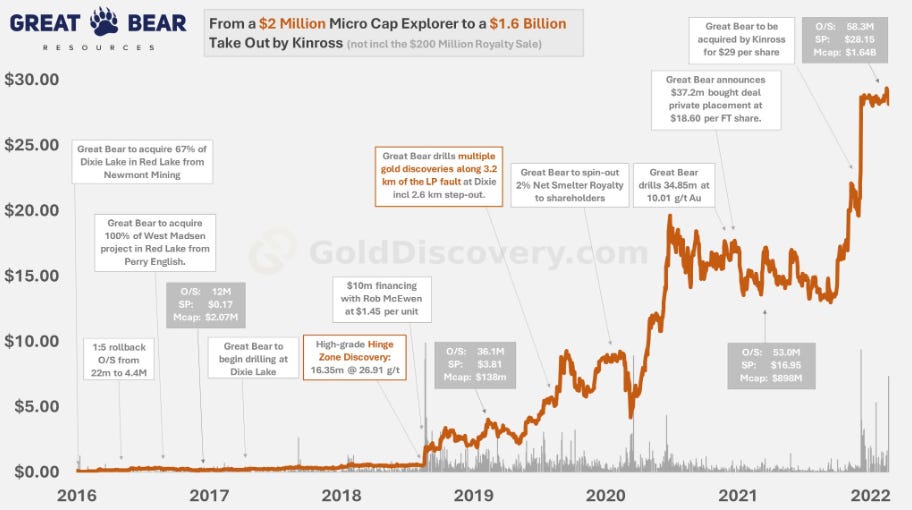
The gap I’m referring to in Great Bear was when the company announced the discovery hole at the Hinge Zone, GBR never came close to filling that open gap in its chart from August 2018.
What about Talon Metals (TSX:TLO, OTC:TLOFF)?
I seem to recall a gap from May 2025 down around $1.10/share (split-adjusted):
Talon Metals (Weekly)
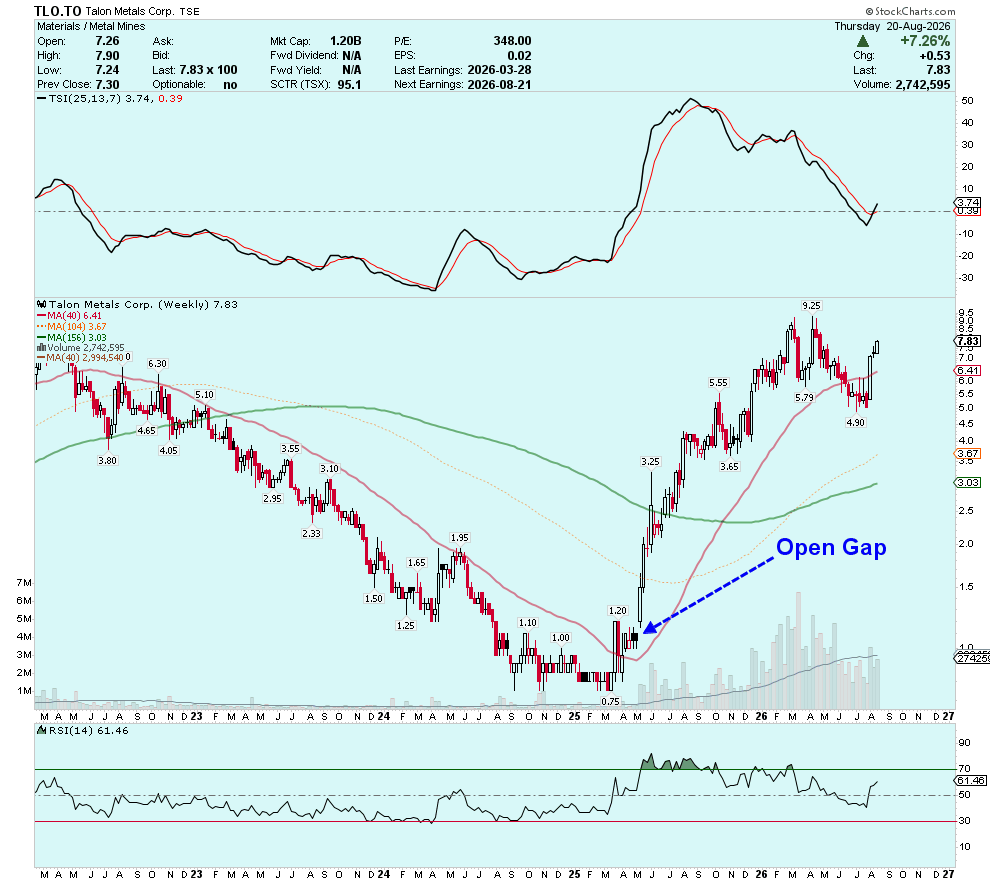
Talon’s May 2025 surge occurred when the 2nd discovery hole at the Vault Zone was announced (35 meters of massive sulfides in hole 563)—in less than 12 months TLO shares advanced nearly 700%!
In the most striking examples, such as Great Bear and Talon, a gap in a chart can be a very bullish signal.
Before delving further into breakaway gaps, let’s first become clear on some definitions.
